It is important to know how to tell if a graph is a function. When you are dealing with a function, the rule is that for every input, there is exactly one output. This rule makes it easy to identify functions. You will need to know how to read a graph but there are a few ways to check a graph and quickly find out if it represents a function or not.
Use the Vertical Line Test
Most graphs have two axes, the x-axis and the y-axis. The x-axis runs left to right while the y-axis runs up and down. Normally, the x value is the input and the y value if the output of a function. The graph represents the set of all points that work for the graph y = f(x).
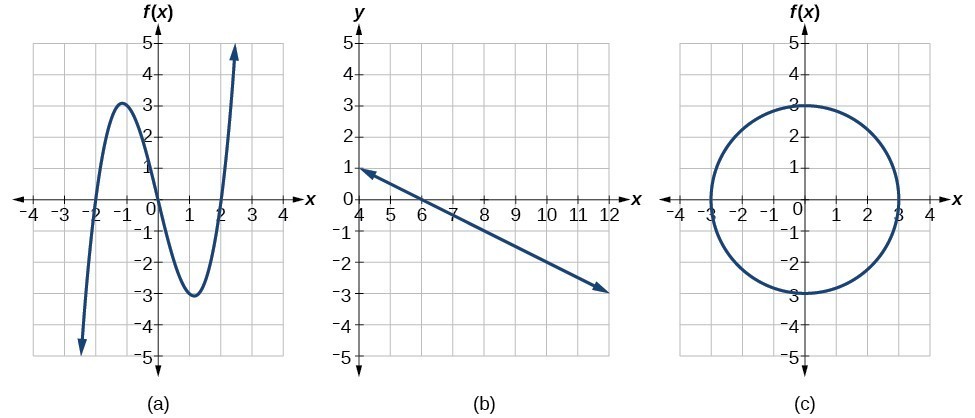
The vertical line test is where you can choose any place on the graph and draw a line. A vertical line is parallel to the y-axis and runs up and down. The line should not intersect more than one point on the graph. If it intersects more than one point, it is not a function. If it intersects one point only, it is a function.
Make a Table of the X and Y Values
When you look at a graph, you will notice that the center of the graph where the x-axis intersects the y-axis is the point (0,0). The values above and to the right are positive; the values below and to the left are negative. You can create a chart with X on one side and Y on the other. For each point on the graph, write the X and Y value. The x value is where the point falls across the x-axis and the y value is where the points fall across the y-axis.
Once you have your chart, make sure that there is only one y value for every x value. If any x value has more than one y value, it is not a function because, by definition, each x value can only have one y value.
List the Ordered Pairs That Are Solutions
The points on a graph are the ordered pairs that solve a function. For example, if you have the graph of f(x) = x + 1, you would come up with ordered pairs to solve the graph. You can start with an x value of 0. 0 + 1 = 1 so the y value is 1. This ordered pair is (0,1). You can choose all of the x values on the graph and test them to see if they each have a different y value.
Take the following list of ordered pairs (1,2), (2,3), (1,4), and (3,2). You do not have a function because the x value of 1 has two different outputs: 2 and 4. This is not a function.
The nice thing about graphs is that they follow rules. Math in general has rules that are always true. If you have to determine whether a graph is a function or not, you can do it fairly easily as long as you know the definition of a function and how to apply it.
The definition of a function is an equation where there is exactly one output for each input. Then you need to understand what the input and output values are. The input value, which is also the x value, is the number that you place into the equation. The output value, also known as the y value, is the solution.
You can examine the graph and make sure that when you draw a vertical line, it only crosses the graph in one place. In addition, you can make a table or list the ordered pairs. As long as there is only one output value for each input, it is a function.